HuangAnqi
理论相关
cp2k
cp2k参数
CP2K输入文件模板
Matlab批量计算CP2K的差分电荷的代码
全波电磁仿真
VESTA:制作差分电荷&导出图片
Oringin制作气泡能带图+DOS图
VASP
vasp+机器学习计算AlN的势函数
vsap机器学习
vasp算微波介电常数
VASP计算参数
vaspkit功能
VASP算bader电荷
计算带格林内森参数投影的高温声子谱
脚本合集
PWmat
用pwmat计算缺陷形成能
Hefei-NAMD
Quantum ESPRESSO
qe算声子谱
CALYPSO结构搜索
Oringin
Yambo
QE+yambo算光吸收虚部
Yambo 光吸收计算后处理
Yambo报错和解决办法
知识点
代码
佛祖保佑
心跳(html)
洛伦兹吸引子
用pandas读取excel 画dos图
用Matplotlib画折线图
蒙特卡洛方法求Π
TensorFlow 代码
罗盘时钟
MATLAB代码
批量重命名图片代码
用Pr将序列帧图片转成视频
蒙特卡洛方法模拟二维平面上的原子沉积和扩散
PyTorch
OVITO
Latex安装与使用
wannier+VASP拟合能带
VASP算有效质量
liuyaoze.com-文档系统
-
+
首页
蒙特卡洛方法模拟二维平面上的原子沉积和扩散
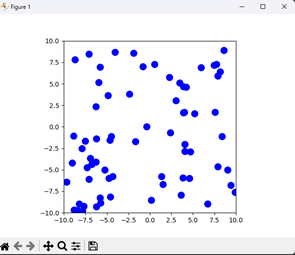
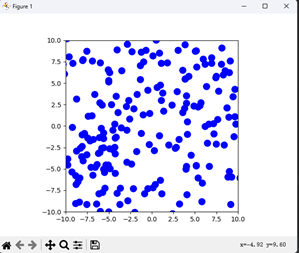
这段代码模拟了粒子在二维空间中的扩散过程。 它使用 np.random.uniform 函数来生成 numparticles 个粒子的随机初始位置,并将其存储在 xlist 和 ylist 数组中。 随后,代码使用 update(i) 函数模拟时间步骤的运动。该函数接收一个参数 i,表示当前时间步长的索引。最初的位置数据存储在 positions 变量中,随后每个粒子会有一个随机位移的步长,随机位移的大小通过np.random.normal 函数计算,具体计算包括每个步长的标准方差和目标时间步长 delta t,同时假设粒子扩散是在两个方向上是相互独立的。这些所得到的位移将更新每个粒子的当前位置。 代码使用随机位移的方式模拟每个粒子在每个时间步长中的运动,随机位移的大小和方向是基于正态分布随机生成的。 具体来说,代码中使用了 np.random.normal 函数生成符合正态分布的随机变量,该函数使用了以下参数: - loc:正态分布的均值,这里的值为 0。 - scale:正态分布的标准差,这里的值为 np.sqrt(2diffcoeffdeltat),其中 diffcoeff 是扩散系数,deltat 是时间步长。 - size:生成随机数的数量和形状,这里的形状为 (numparticles, 2),表示同时生成 numparticles 个具有两个坐标轴(x 和 y)的随机位移。 然后,代码将这些随机位移向量添加到每个粒子的当前位置上以模拟每个粒子的随机运动。因此,随机位移的大小和方向实际上决定了每个粒子的运动概率分布,并在模拟中使用随机位移来模拟此分布。 随着不断地进行迭代,代码使用 plt.scatter 函数在二维空间中可视化所有粒子的位置,并在每5个时间步长后添加5个新的粒子。为了保证新添加的粒子在每个时间步长中也能被更新,代码增加了一个 global numparticles 变量追踪当前粒子的总数,并在添加新的粒子时更新 numparticles 来反映更改。 最后,代码使用 FuncAnimation 函数来生成动画,FuncAnimation 函数以 update 函数、时间步长、以及一组关键字参数作为输入,返回一个可供播放的动画。 ```python # We will be using the matplotlib library to generate the animation. # First, let's import the required libraries import numpy as np import matplotlib.pyplot as plt from matplotlib.animation import FuncAnimation # Define parameters for the simulation num_particles = 50 # Number of particles in the simulation diff_coeff = 0.05 # Diffusion coefficient delta_t = 0.1 # Time step for the simulation time_steps = 100 # Number of time steps in the simulation x_lims = [-10, 10] # Limits for the x axis of the plot y_lims = [-10, 10] # Limits for the y axis of the plot # Create initial positions for the particles x_list = np.random.uniform(low=x_lims[0], high=x_lims[1], size=num_particles) y_list = np.random.uniform(low=y_lims[0], high=y_lims[1], size=num_particles) positions = np.stack((x_list, y_list), axis=1) # Define a function that updates the positions of the particles based on random motion and deposition def update(i): global positions, num_particles # Generate a random displacement for each particle random_displacement = np.random.normal(0, np.sqrt(2 * diff_coeff * delta_t), (num_particles, 2)) # Ensure shapes match assert random_displacement.shape == positions.shape, f"Shapes do not match: {random_displacement.shape} vs {positions.shape}" # Update positions of each particle positions += random_displacement # Deposition of new particles every 5 time steps if i % 5 == 0: new_particles = np.random.uniform(low=x_lims[0], high=x_lims[1], size=(5, 2)) num_particles += 5 positions = np.concatenate((positions, new_particles)) # Plotting plt.clf() plt.xlim(x_lims) plt.ylim(y_lims) plt.gca().set_aspect('equal', adjustable='box') plt.scatter(positions[:, 0], positions[:, 1], marker='o', s=100, color='b') # Generate the animation ani = FuncAnimation(plt.gcf(), update, frames=time_steps, interval=100) plt.show() # Display the animation ``` 在PyCharm中运行可得动图: 一开始截图  运行一段时间后截图 
huanganqi
2023年5月8日 17:18
161
0 条评论
转发文档
收藏文档
上一篇
下一篇
手机扫码
复制链接
手机扫一扫转发分享
复制链接
【温馨提示:本站文档可配置可见范围,如登录后可见、对特定群组可见等,看不到或进不去就是没权限】
暂时不开放注册
Markdown文件
Word文件
PDF文档
PDF文档(打印)
分享
链接
类型
密码
更新密码
有效期