HuangAnqi
理论相关
cp2k
cp2k参数
CP2K输入文件模板
Matlab批量计算CP2K的差分电荷的代码
全波电磁仿真
VESTA:制作差分电荷&导出图片
Oringin制作气泡能带图+DOS图
VASP
vasp+机器学习计算AlN的势函数
vsap机器学习
vasp算微波介电常数
VASP计算参数
vaspkit功能
VASP算bader电荷
计算带格林内森参数投影的高温声子谱
脚本合集
PWmat
用pwmat计算缺陷形成能
Hefei-NAMD
Quantum ESPRESSO
qe算声子谱
CALYPSO结构搜索
Oringin
Yambo
QE+yambo算光吸收虚部
Yambo 光吸收计算后处理
Yambo报错和解决办法
知识点
代码
佛祖保佑
心跳(html)
洛伦兹吸引子
用pandas读取excel 画dos图
用Matplotlib画折线图
蒙特卡洛方法求Π
TensorFlow 代码
罗盘时钟
MATLAB代码
批量重命名图片代码
用Pr将序列帧图片转成视频
蒙特卡洛方法模拟二维平面上的原子沉积和扩散
PyTorch
OVITO
Latex安装与使用
wannier+VASP拟合能带
VASP算有效质量
liuyaoze.com-文档系统
-
+
首页
蒙特卡洛方法求Π
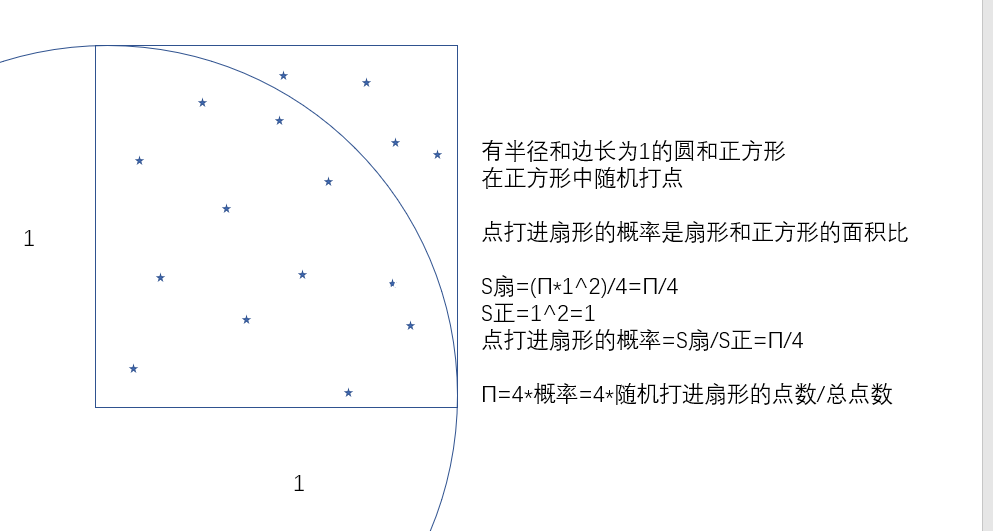
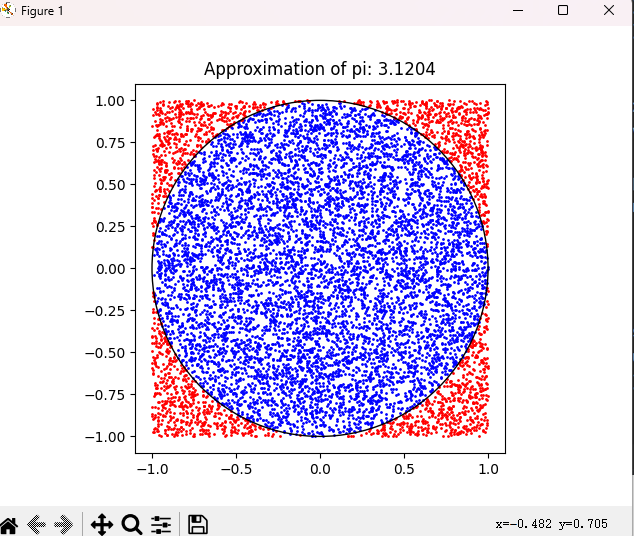
蒙特卡罗法也称统计模拟法、统计试验法。是把概率现象作为研究对象的数值模拟方法。是按抽样调查法求取统计值来推定未知特性量的计算方法。 蒙特卡罗是摩纳哥的著名赌城,该法为表明其随机抽样的本质而命名。故适用于对离散系统进行计算仿真试验。在计算仿真中,通过构造一个和系统性能相近似的概率模型,并在数字计算机上进行随机试验,可以模拟系统的随机特性。 采用概率来求Π  采用Python来实验 ```python #dots = 5 PI=3.2 #dots = 50000 PI=3.13736 import random dots = 5 #总点数 incount = 0 #打在扇形内部的点数 for i in range(dots): x = random.random() y = random.random() distance = (x**2+y**2)**0.5 if distance <= 1: #距离圆心的距离小于1则证明该点在扇形内 incount += 1 PI = (incount/dots)*4 print("Π是",PI) ``` 打的点数越多,概率就越准,越接近面积比,答案就越接近Π 参考视频 [【智源学院】30分钟了解蒙特卡罗方法-有意思专题系列(蒙特卡洛方法)(Monte Carlo method)-哔哩哔哩](https://b23.tv/NcJPJSg "【智源学院】30分钟了解蒙特卡罗方法-有意思专题系列(蒙特卡洛方法)(Monte Carlo method)-哔哩哔哩") 使用cursor,AI写代码,加入可视化的图片 ```python # Define the number of points to generate num_points = 10000 # Initialize variables to keep track of points inside/outside the circle inside_circle = 0 outside_circle = 0 # Initialize lists to store x and y coordinates of points x_inside = [] y_inside = [] x_outside = [] y_outside = [] # Generate random points and determine if they are inside or outside the circle for i in range(num_points): x = random.uniform(-1, 1) y = random.uniform(-1, 1) if x**2 + y**2 <= 1: inside_circle += 1 x_inside.append(x) y_inside.append(y) else: outside_circle += 1 x_outside.append(x) y_outside.append(y) # Calculate the value of pi using the Monte Carlo method pi = 4 * inside_circle / num_points # Plot the points and the circle fig, ax = plt.subplots() ax.set_aspect('equal') ax.scatter(x_inside, y_inside, color='blue', s=1) ax.scatter(x_outside, y_outside, color='red', s=1) circle = plt.Circle((0, 0), 1, color='black', fill=False) ax.add_artist(circle) plt.title(f"Approximation of pi: {pi:.4f}") plt.show() ``` 
huanganqi
2023年4月20日 11:11
94
0 条评论
转发文档
收藏文档
上一篇
下一篇
手机扫码
复制链接
手机扫一扫转发分享
复制链接
【温馨提示:本站文档可配置可见范围,如登录后可见、对特定群组可见等,看不到或进不去就是没权限】
暂时不开放注册
Markdown文件
Word文件
PDF文档
PDF文档(打印)
分享
链接
类型
密码
更新密码
有效期